Imagery
The majority of the tools that will be implemented in the framework of the The TAHMM research programme provides raster data that needs to be analysis. The possible treatments differ according to the types of rasters. ¤ Classical" image where each pixel expresses a colour value (3 bands -- Red, Green, Blue), ¤ Image translating the relief where each pixel completes the colour information with the altitude, ¤ A multispectral image that adds to the colour value that of a 4th or more band, like the PIR (Near Infra Red), ¤ Thermal image where each pixel adds the temperature to the colour value.
From these different rasters, it is possible to make different treatments. Photo-interpretation, the calculation of vegetation indices, the unsupervised classification or detection of micro-reliefs ... etc.
Photo-interpretation
Aerial images can be used to identify anomalies, variations soil colour (Soil marks) (Fig. 1) or vegetation colour (Crop marks) (Fig. 1) which may be indicative of the presence of archaeological structures buried.
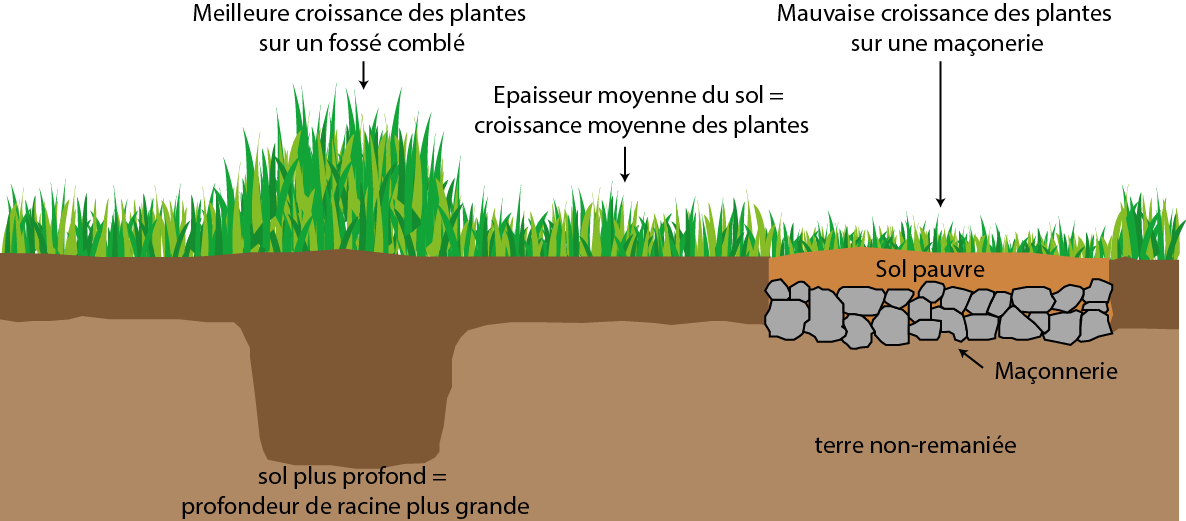
Figure 1 - Crop marks
It is also possible to locate archaeological remains with images made with a strong grazing light.
The first vector used for these acquisitions will be the aircraft because they have a good autonomy which allows them to cover large areas or ULM (Ultra Light Motorized) because they allow slower flights at low altitude.
However, these two vectors have a high cost of use (currently 150 per hour) and require complex implementation. The use of a pilot, the require a planning of flights several weeks in advance, reduces the control of optimal observation conditions, whether they are weather or light. Another disadvantage is that acquisitions do not cannot be made below 150 meters of altitude and unless of 140 km/h, which makes the shooting more complex (increase in the number of of blur) and gives an average spatial resolution of the images. All of these constraints are factors limiting the possibility of repeatability of acquisitions and therefore of working in multitemporal. (Poirier N. , 2018)
In the 2010's, the use of civilian UAVs has become more democratic. The deployment of UAVs equipped with security systems (return home, semi-automatic take-off and landing, waypoint navigation), the minaturisation of digital photographic sensors and digital means of data storage and transmission, allowing for today to propose a real technological breakthrough in the detection of archaeological remains.
It is in this spirit that the members of the Terrae team have developed the Archéodrone research programme (Poirier, Hautefeuille, &) Calastrenc, 2013). This programme aims to combine flexibility the use of UAVs, the possibility they offer of varying the the height of the acquisitions from 1 to 150 metres. The lowering of the height of flight and the fact that the speed of flight of drones can be controlled and limited (generally at 4m/s) means that the shots taken are not have a very good spatial resolution (pixels are usually a few square centimetres), which has a major impact on capacity of detection. In addition, the possibility of carrying out several flights at the same places at different times of the day and/or year, combined with the regularity of the scheduled flights makes it possible to carry out multi-temporal analyses. (Poirier, Hautefeuille, & Calastrenc, 2017)
Has the lowering of the acquisition height for aerial images had an impact on the what impact on the capacity to detect archaeological remains? With the IGN's provision of orthophotographs with an spatial resolution of 20 cm, a photo-interpretation can not, by itself prove sufficient? The limits of the photo-interpretation are known and are marked by times of and a heterogeneity of interpretation according to the different images and operators. (Sparfel, Gourmelon, & Le Berre, 2008)
Photo-interpretation therefore allows the localisation of areas with a archaeological potential. It can be a tool for the realisation of an initial assessment. However, it needs to be coupled with other types of image processing and spatial analysis.
Multispectral imaging
When seeking to adapt detection methods to prospect a larger territory, the archaeological question of the use of satellite imagery arises.
Automatic or semi-automatic site detection works high and medium mountain archaeological sites by image processing have already been completed.
However,
-
The radiometric resolution of satellite images is currently only not sufficient for a "quality" identification of the sites archaeological. Indeed, free satellite images have a pixel size of at best 1.5 m. For these type of images, the Spot 6/7 satellite provides the more efficient images. As for the satellite images for a fee, with pixels of respectively 0.3 m and 0.5 m, the best spatial resolutions are from images [Worldview 4] [http://worldview4.digitalglobe.com/) and Pleiade THRS. It is necessary to however, point out that the problem of spatial resolution can be moderated by a multi-source approach (De Laet & Lambers, 2009, p. 12).
-
The complexity and extreme variety of the forms to be detected is the second pitfall (Rendu, Calastrenc, Le Couédic, & Berdoy, 2016, p. 69 and 70, Le Couédic, 2010, pp. 511-515). How to spot all, or at least the vast majority, of structures of a pasture where the plans, areas, and the states of conservation diverge? How to identify totally levelleroded buildings, generally the oldest ones, entirely covered by vegetation and visible only by micro-reliefs of about ten centimetres in height or in the form of an alignment of a few scattered stones?
Working with satellite images has two advantages :
-
They allow you to work on several spectral bands. It is thus possible to make index calculations.
-
They allow for unsupervised classifications to be carried out and/or object supervised.
It is now possible to carry out these analyses (calculation of the index, supervised and unsupervised classification) from of multispectral images taken by drone. The lowering of the height of data acquisition allows for better spatial resolution (Poirier, Hautefeuille, & Calastrenc, 2013) and therefore more finer classification. For example, with a fixed-wing UAV, the [DT18 from Delair Tech'] (https://delair.aero/portfolio/dt-18-hd/) (Fig. 5), the multispectral image (R, G, B, PIR and Red Edge) output, taken at 100 m in height, will have a pixel of 7.5 cm as opposed to 50 cm for an Pleiade satellite image. Theoretically, with the images of this drone, it would be possible to detect objects of about 15 centimetres in size. against 1 m for Pleiade images. The fact remains that the use of this drone in the high mountains is complicated. Strong reliefs make it very difficult to its use because the incidence rates needed are superior to those supported by this drone. Sound use cannot be generalised. However, a sensor multispectral, or hyperspectral, implemented on a UAV at rotating canopy would solve this problem. It's the cas of the [DJI Phantom 4 Multispectral] (https://www.dji.com/fr/p4-multispectral) allows the acquisition of images in R, G, B, but also in Near Infrared and Red edge.
Vegetation indices
Multi-spectral satellite sensors record radiation solar energy reflected by "the Earth".
The images acquired by multispectral satellites therefore make it possible to distinguish different "spectral signatures" depending on the surfaces. For example, the vegetation reflects more on the beaches spectral ranges from 0.7 to 0.9 micrometres, whereas a bare soil can be will be characterised by a spectral signature ranging from 0.6 to 0.7 micrometer.
The spectral resolution of satellite images varies according to the satellites. Thus, the free satellite images, of the Spot 6/7 type, is often reduced to 4 spectral bands (the red -R-, the green -V-, the blue -B-and the Near-Infra Red -PIR-). As for the satellites providing a paid service, such as WorldView and Pléiade, they provide a also provide 4-band images (Red, Green, Blue, Near infra-red) but with slightly different spectral ranges.
| Pleiade | Worldview |
|---|---|
| Blue - 450 and 510 nm | Blue - 420 and 500 nm |
| Green - 510 and 580 nm | Green - 520 and 600 nm |
| Red - 655 and 690 nm | Red - 610 and 690 nm |
| PIR - 780 and 920 nm | PIR - 760 and 890 nm |
Each satellite therefore defines the limits of the spectral bands it will perceives. Therefore, not all satellites see the samethings.
To carry out vegetation index calculations, which enable to identify plants, to know their density and/or their state of health, the wavelengths and the intensity of the light will be used. What we are going to try to detect is the impact buried archaeological structures on growth or colour vegetation (Fig. 2)
The most commonly used vegetation indices are the Normalized Difference Vegetation Index (NDVI), the Normalized Difference Vegetation Index (NDVI), the Normalized Difference Vegetation Enhanced Vegetation (EVI) or the Soil Adjusted Vegetation Index. (SAVI), are used to calculate the density of the vegetation or Tworking with water stress (MSI). (Lasaponara & Masini, 2006, Agapiou, Hadjimisis, & Alexakis, 2012) Also used are improvement of histograms and Principal Component Analyses (ACP).
In recent years, researchers have been working on improving the multispectral image processing for detection archaeological by the use of linear equations. These equations which were developed for a number of satellite sensors at medium and high resolution (mainly QuickBird and GeoEye, all of which are two with a very high spatial resolution with a pixel of 46 cm). They allow to obtain a new 3D spectral space where the 3 components are : plant growth, crops, soil. (Agapiou, Lysandrou, Lasaponara, Masini, & Hadjimitsis, 2016 ;
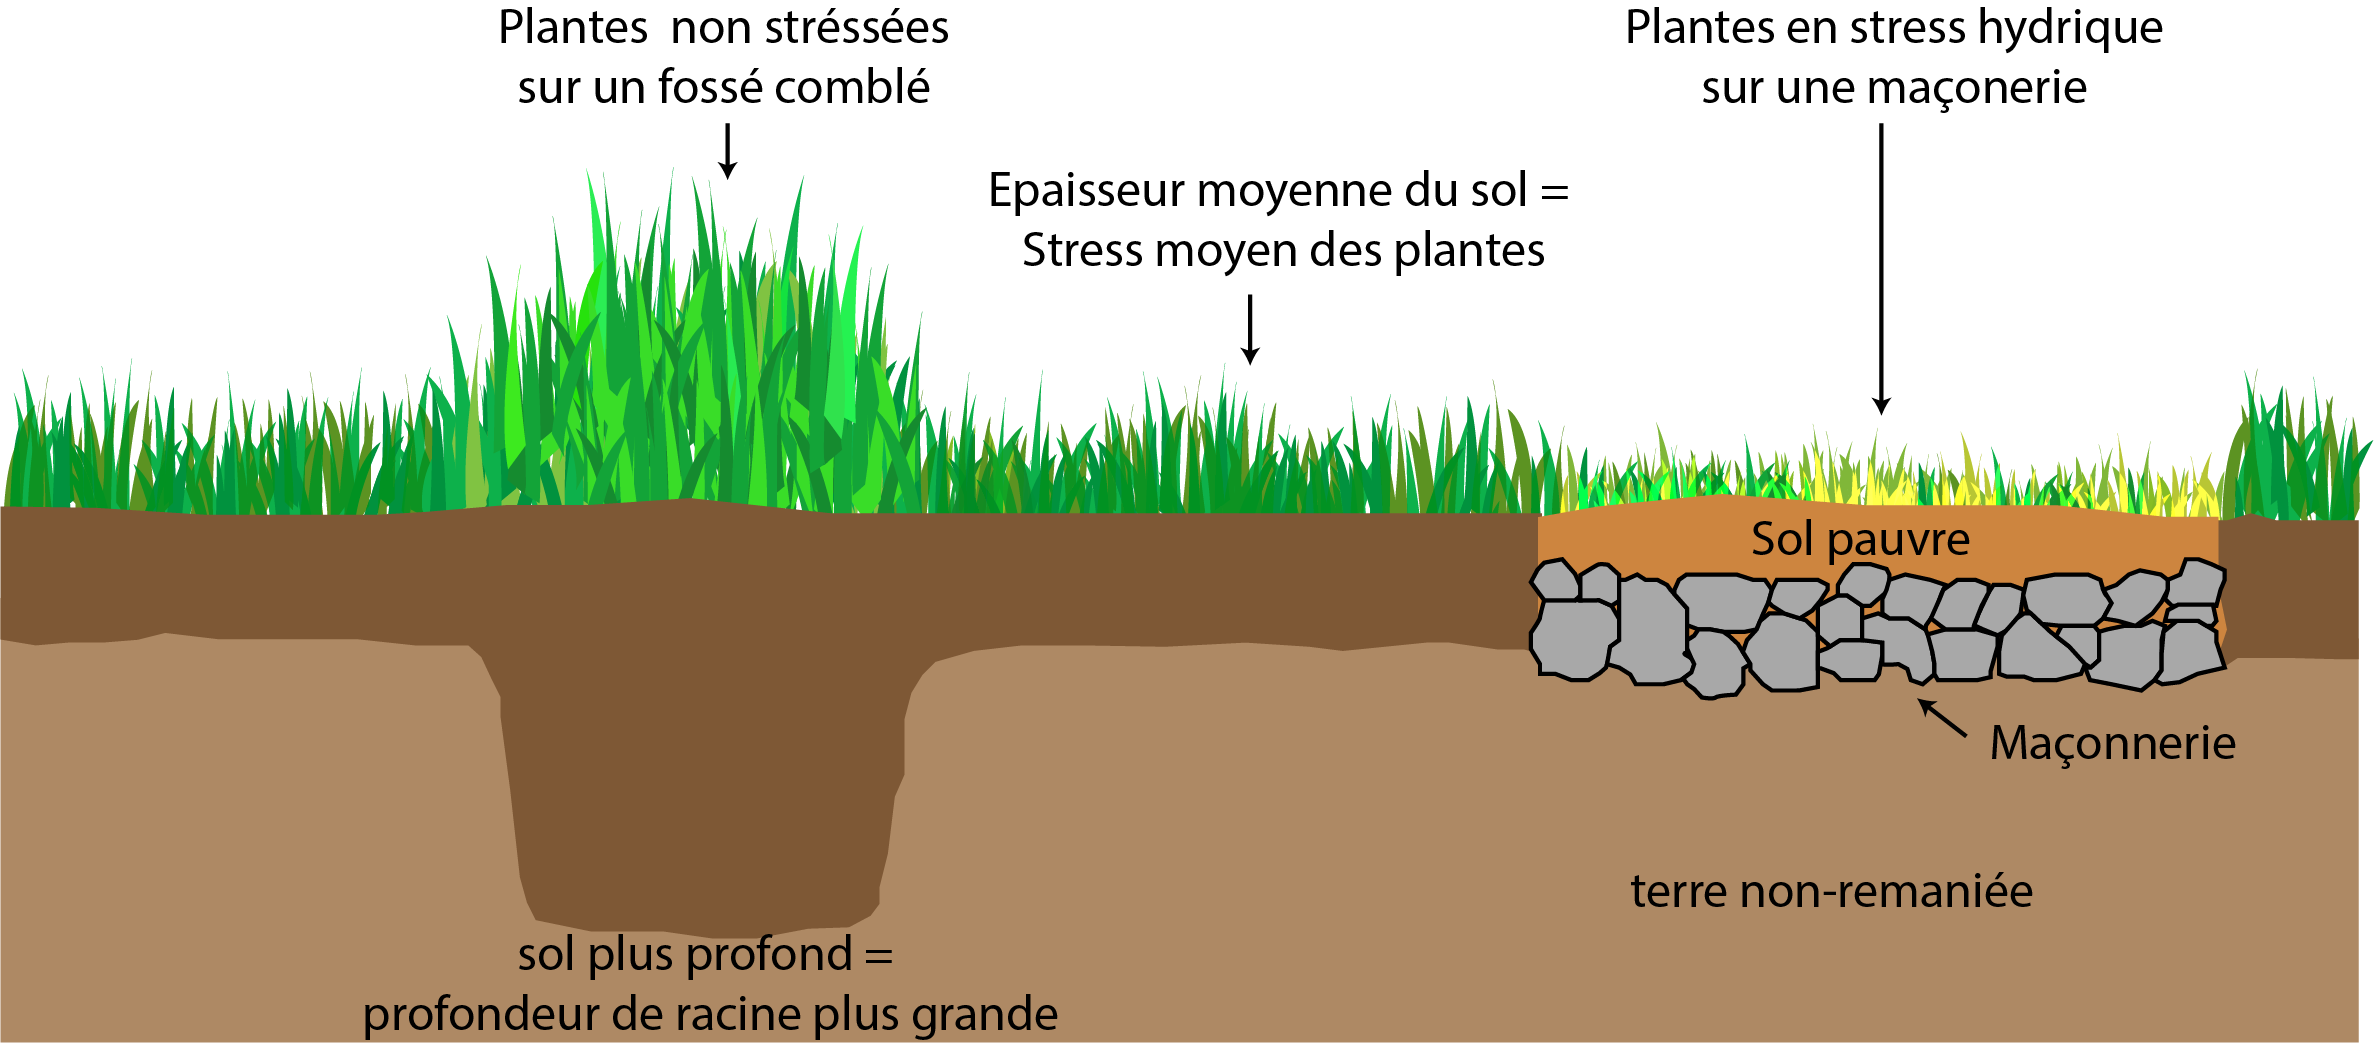
Figure 2 - Principle of vegetal water stress
Image classification
The processing of multispectral images can also be a little more by performing unsupervised or guided classifications object. (Ducrot, 2005)
Unsupervised classification.
In an unsupervised or semi-supervised classification, the objects are not determined by the operator, but by the algorithms.
To classify the image, these algorithms use the spectral value pixels.
The operator determines the number of classes he wishes to obtain and can also define parameters for the distance between classes. Once the algorithm to perform the classification, the operator assigns a name to each class and/or can combine several classes. (Fig. 3)
supervisée](images/imagerie/media/image3.png)
Figure 3 - Principle of unsupervised classification
Purpose-oriented classification
In contrast to unsupervised or semi-supervised classification, the Object Oriented Classification (OOC) does not process pixels. individually, but is based on groups (objects) defined by the operator.
This approach requires a very detailed knowledge of the objects to be handled first of all, it is necessary to define them (here, the archaeological structures) and therefore have a reference system at their disposal. It is therefore necessary to establish a nomenclature of the objects sought and to identify the variables that define them. This is the class definition stage, which is carried out by the user and corresponds to the objects he or she is research.
The second step consists of cutting out the space, segmenting the image, by sections, in groups of pixels, of the same appearance. This grouping will cover not only the spectral values of the pixels but also on the size, shape and its neighbourhood During this step, the pixels are gradually grouped together with their neighbours to create objects of while respecting a threshold of heterogeneity (Sparfel, Gourmelon, & Le Berre, 2008). The threshold heterogeneity is calculated by taking into account the colour of the pixels, which is the reference to the spectral value, and to the shape of the object, which corresponds to its texture. It is a question of determining the classes (a nomenclature of classification) and to provide samples to enable initialization and validation of the classification. It is therefore necessary to take into account the size of the objects you wish to identify. If it is greater than the size of the pixels of the image, the constraints the pixel determination for classification is weak. If the object is smaller than the size of the pixels of the image, the constraints of pixel selection for classification will be strong.
This is followed by a validation of the learning which can be inter-class or intraclass. (Fig. 4)
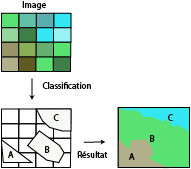
Figure 4 - Principle of supervised classification
The advantage of supervised classification is that it is based on the knowledge of researchers, but cannot be used in the framework of a first approach to a sector. It cannot be generalised to the whole of a massif for example.
Airborne thermography by UAV **Aircraft thermography
Aircraft thermography has been used since the 1970s in archaeology (Tabbagh, 1977, Lundén, 1985, Bellerby, 1990). This technique, which is costly and complicated to implement, has been almost abandoned by archaeologists. However, there has been a revival of interest in the field since a few years. The recent minaturisation of infrared sensors and the improvement of their spatial and spectral resolution allows the detection of fine thermal anomalies (Cailloce, 2015) It is in 2011 that the Terrae team has started the first remote sensing tests archaeological by drone thermography. (Poirier N. H., 2013)
Airborne thermal prospecting is based on the principle that there is a thermal difference in the surface temperature or the vegetation on areas containing archaeological structures buried in relation to the environment (Eppelbaum, 2009). The structures will tend to react differently to buried archeological temperature changes in relation to the surrounding sediments, and the heating or the cooling more or less rapidly depending on their nature. For example, structures built in stone will have a greater thermal inertia than the surrounding sediments. What we will therefore be able to observe in thermography by drone, it is a high thermal inertia (Fig. 5) at the location of the structures archaeological. For example, in a grain field, the roots of the plants come into contact with archaeological remains such as plants and walls. The plants located on these remains will have less water and less nutrients than others. They will therefore be stressed and will tend to heat more than others. (Poirier, 2012 ; Poirier, Aerothermal Prospecting, 2016)
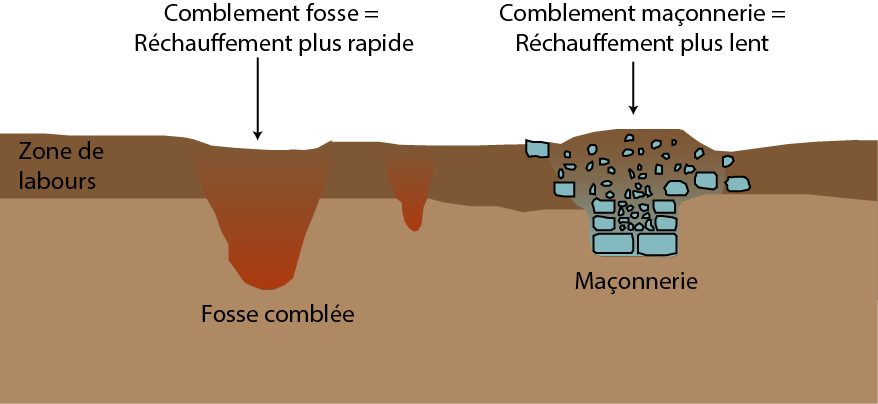
Figure 5 - Principle of thermography in archaeology
Coupling this technology with a drone allows to overcome the strong constraints of acquisitions by aeroplane or helicopter. It is this which was developed within the framework of the Archéodrone programme. For the Terrae team, the first type of sensor implemented on a UAV was a camera for photogrammetric work (see chapter Photogrammetry) and a thermal camera for detection by thermography. For the thermography, the choices were made on an octorotor UAV equipped with a FLIR T620 thermal imaging camera mounted on an shuttle equipped with a horizontal axis of rotation. This camera allows to obtain thermal images in the infrared range thermal range from 7.5 to 14 µm with a sensitivity of 0.04°. The resolution of the images is relatively low (480 x 640 pixels) but this can be partly compensated for by lowering the altitude of the flight. These images are processed in a software program FLIR dedicated "Flir Tools". (Poirier, Hautefeuille, & Calastrenc, 2013). The initial work of the TAHMM programme made it possible to set up a treatment procedure (Calastrenc et al, 2021).